Measuring Quality
Program Quality Indicators
All programs consistently complete URM students at the same rate as non-URM students.
All programs consistently run 50+ NPS on Mid and End Course with 75% retention rates, after the add | drop period.
Instructors teaching for CodePath, across modalities, rate their onboarding, training, and coaching experience 50+ NPS.
Instructors teaching for CodePath represent the lived experience of our learner population across race, income and gender.
Curriculum and pacing will have an average rating of 4 on Mid and End of course surveys.
URM students engaged in career services across all programs at the same rate as non-URM students.
Employers and volunteers consistently report a positive experience working with the CodePath and the Career Center and consistently increase engagement across multiple opportunities.
65% of sophomore and junior students secure an internship within 1 year of completing a course.
65% of seniors secure full-time competitive employment within 1 year of graduation.
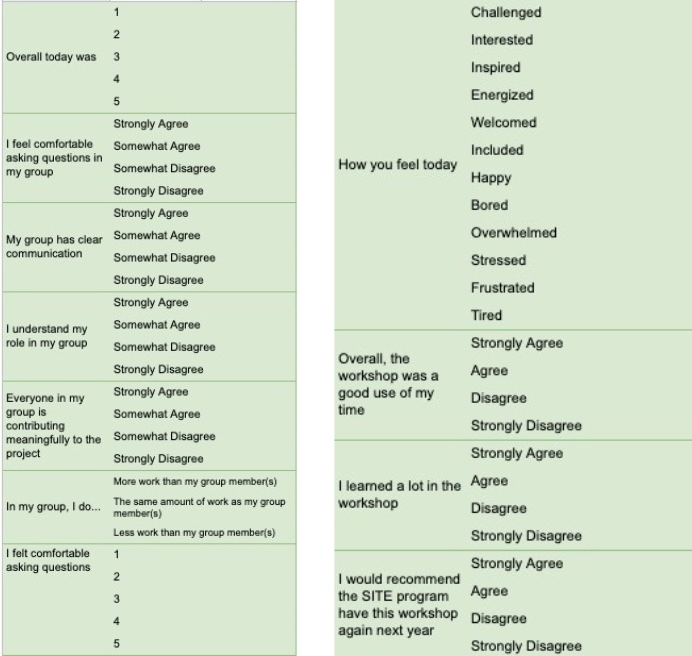
Session Survey Feedback
Course Evaluation
Quantitative Measures
All quantitate measure a desegregated by race, income and gender identification.
NPS Score - How do students self-report their likelihood to recommend the course to others (i.e "How likely are you to recommend this course to other students?")
Completion Rate - What % of students overall complete the course objectives successfully? What % from admitted, what % from week 3? How do URMs compare to total students on these metrics?
Retention Rate - What % of students overall complete the course objectives successfully? What % from admitted, what % from week 3? How do URMs compare to total students on these metrics?
Course Completion rate - What % of students take >2 classes?
Honors Rate - What % of student complete with Honors?
Tech Fellow & Tech Support Representative Hiring Rate - What % of students are hired as Tech Fellow & Tech Support Representative
Student Impact - these are rated 1-5
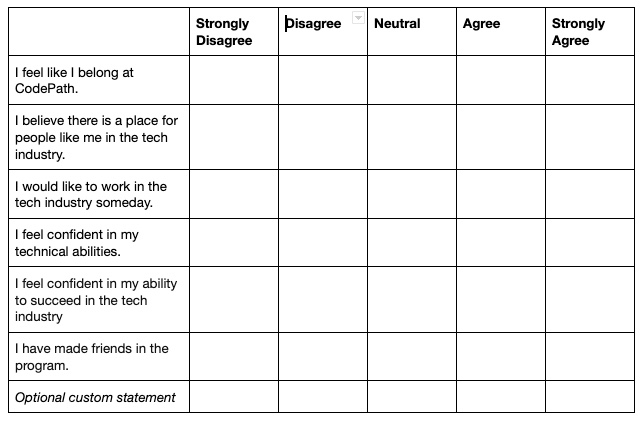
Qualitative Measures
How do students self-report the impact of the course in specific ways we want the course to help.
Net Promotor Score
This is the best possible course experience, world-class and exceptional. NPS is 70+ and completion rates are over 90%.
Green - This is an exceptional course, with an incredible student experience, and high completion rates. NPS is 50+ and completion rates are over 80%.
Yellow - This is a great experience, with an overwhelmingly positive student experience. NPS is 30+ and completion rates are over 70%.
Red - This is a good experience, with a majority positive student experience. NPS is <20 NPS and completion rates are over 60%.
Last updated